Simple View Manual Of Trace Profiling
1. Trace Filtering
According to Container name + pid, find the request url that you need to detect, and select a Profile record. After that, the main page of the system will display the basic information of this trace and all the worker thread analysis
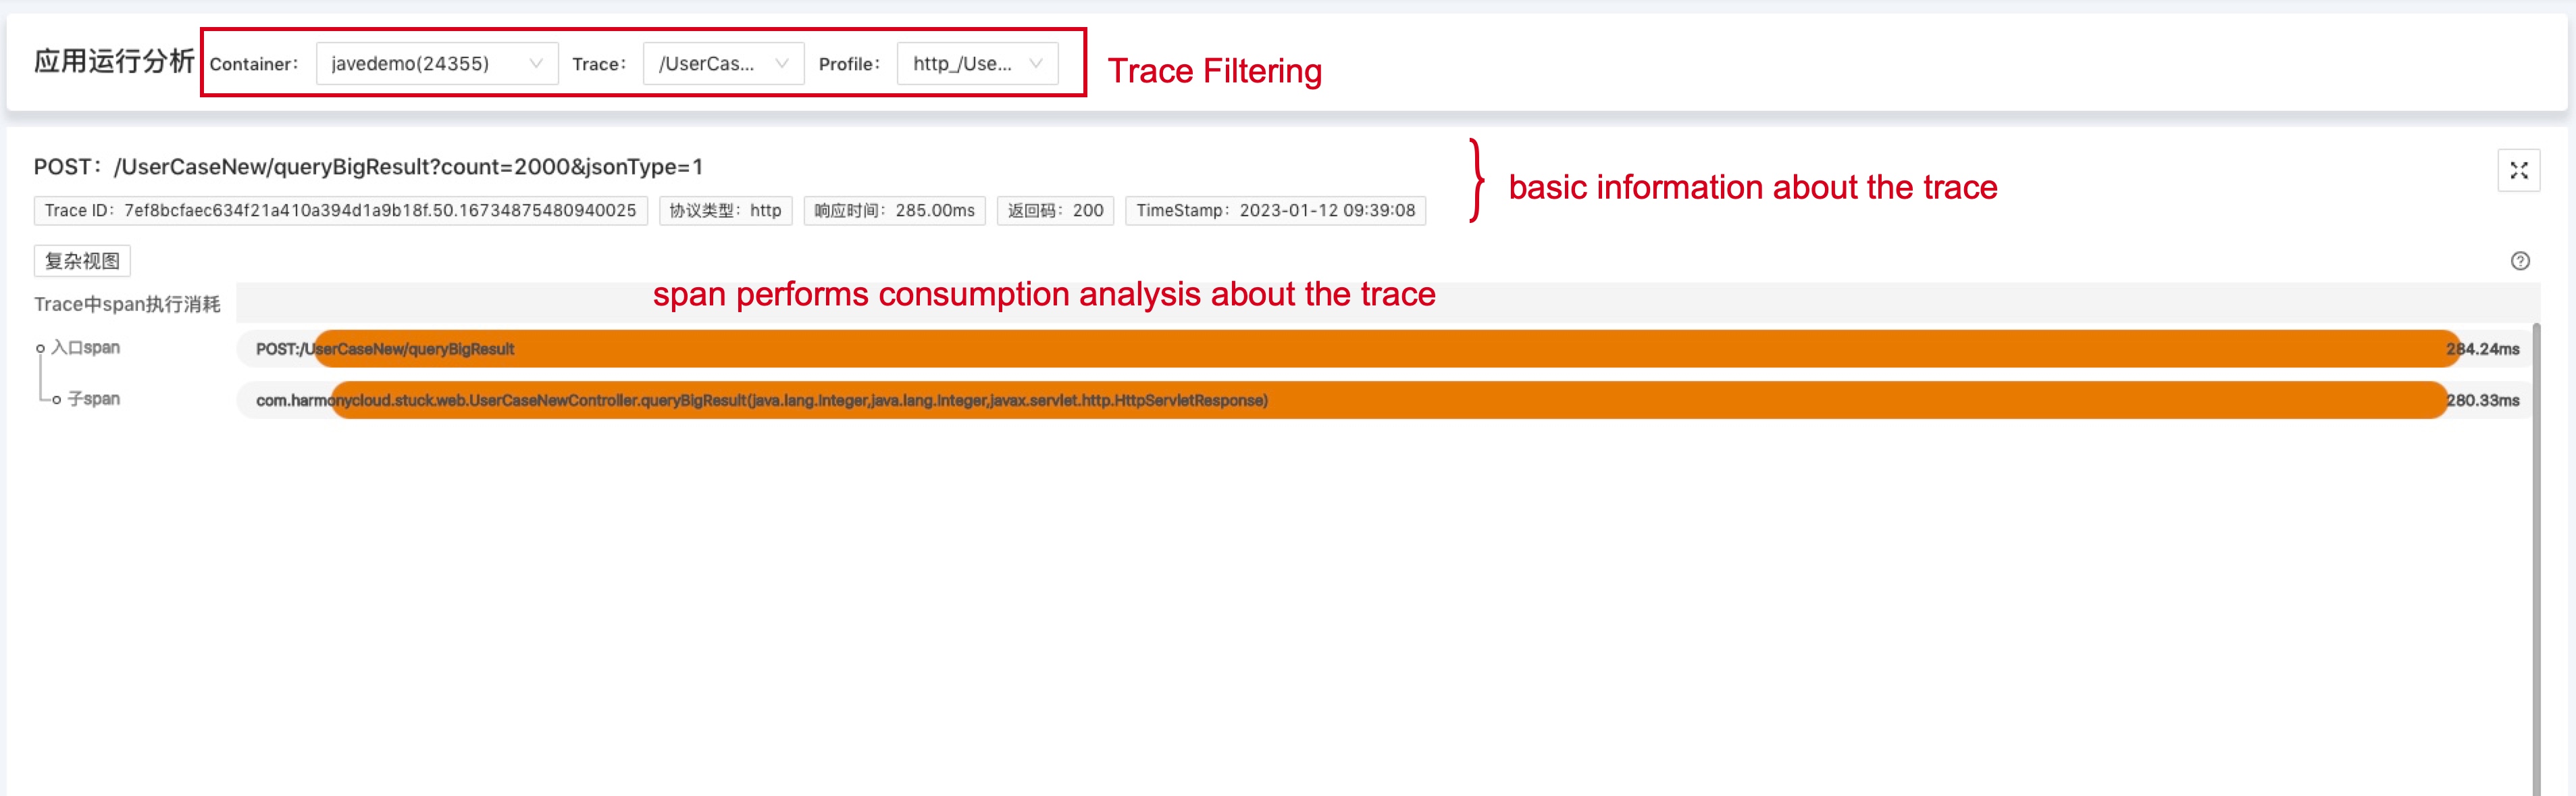
As shown in the figure above, the orange part of span represents the start and end time range of span. The darker the color and the longer the length, the longer the corresponding time
2. Trace Analysis
Click on span to view specific thread event analysis, as shown below.
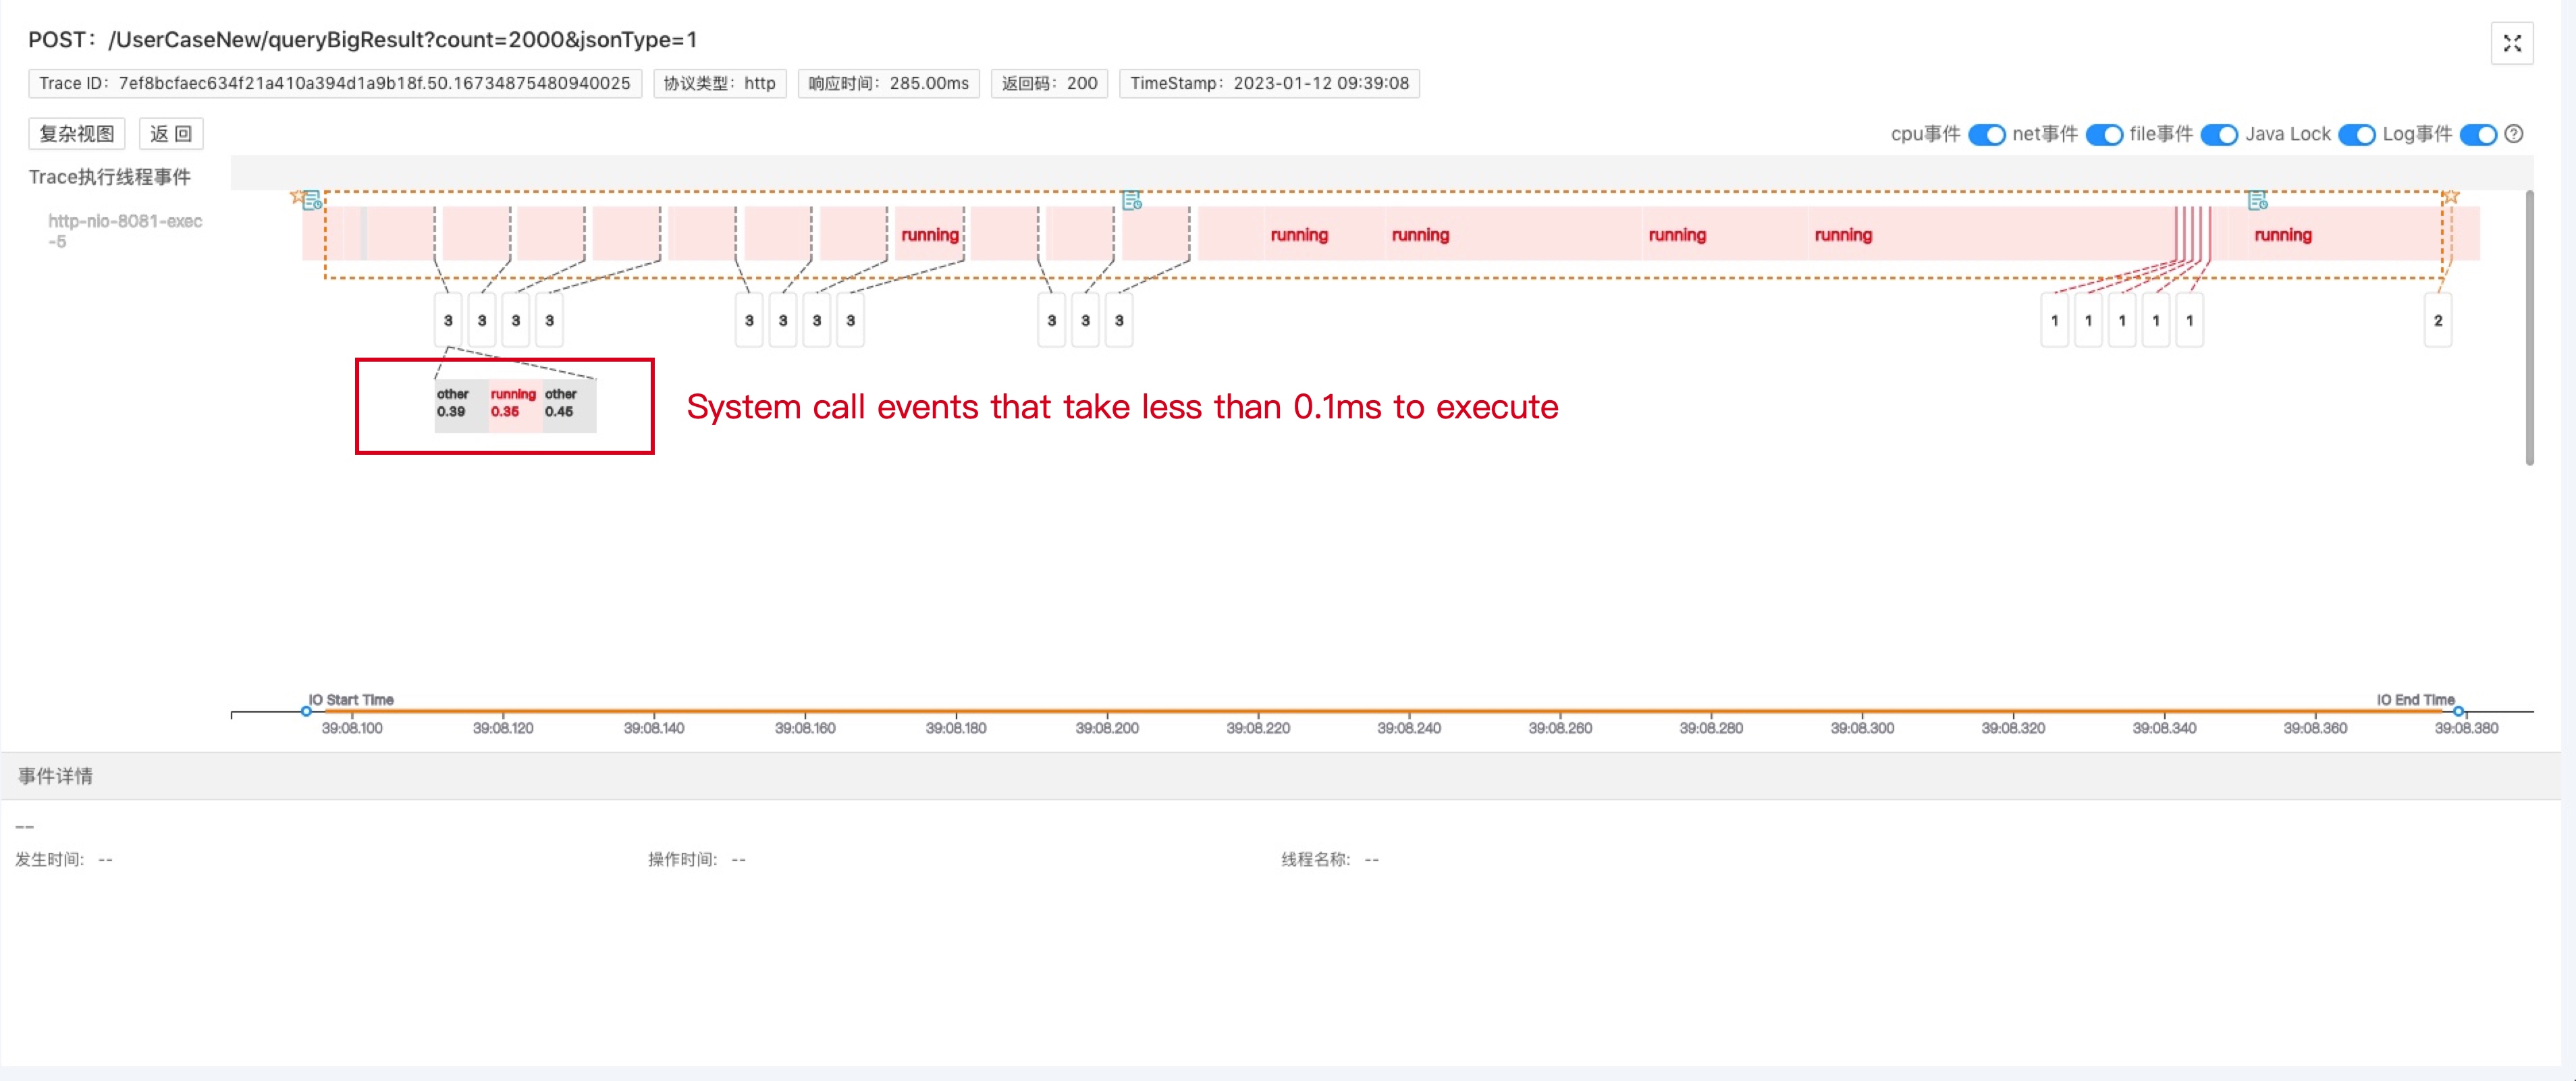
The orange dotted line in the image above represents all of the events performed by the span you just clicked. Each color block represents a system call event executed by the thread.
3. Thread System call event word description
- futex: The thread is tamping, or waiting
- running: CPU-on: indicates that the thread is performing CPU calculations
- epoll: The thread is querying the read/write status of the system kernel file descriptor
- net: The thread is making network calls, such as connecting to the database, calling the downstream interface, listening for network requests, and so on
- netread: netread means reading network data flows (for clients to read responses and for servers to read requests)
- netwrite: netwrite refers to writing network data streams (writing requests for clients and responses for servers)
- fileopen: open the file
- fileread: read the file
- filewrite: write the file
- lock: The thread performs a lock operation